Data management
Adult body weight, PCV and percentage time parasitaemic or treated
Least squares estimates were then calculated in GenStat using REML separately for bulls and cows with terms for age class and 6-month period as fixed effects and animal as a random effect.Herd was not necessary as this was included within the animal term.
 To do this it was necessary to include just data for bulls, likewise subsequently for cows. This was done by first using Spread → Restrict/Filter → Subset on Update
to ensure that the restricted data set only was used for analysis, rather than just for display purposes,
and then by using Spread → Restrict/Filter → To Groups (factor levels)... to include only values with Sex=1.
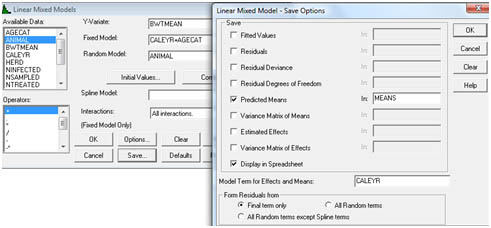
The data analysis (Stats → Mixed models (REML) → Linear mixed models…) was then conducted as shown by the dialog boxes below for body weight - saving the predicted mean values for seasonal period (CALEYR) in a spreadsheet. It is then a simple matter to copy and paste the column of mean values into the appropriate column in CS10Data5. This process was repeated for each of the variables, both for males and for females. To do this it was necessary to include just data for bulls, likewise subsequently for cows. This was done by first using Spread → Restrict/Filter → Subset on Update
to ensure that the restricted data set only was used for analysis, rather than just for display purposes,
and then by using Spread → Restrict/Filter → To Groups (factor levels)... to include only values with Sex=1.
The data analysis (Stats → Mixed models (REML) → Linear mixed models…) was then conducted as shown by the dialog boxes below for body weight - saving the predicted mean values for seasonal period (CALEYR) in a spreadsheet. It is then a simple matter to copy and paste the column of mean values into the appropriate column in CS10Data5. This process was repeated for each of the variables, both for males and for females.
|
 To do this it was necessary to include just data for bulls, likewise subsequently for cows. This was done by first using Spread → Restrict/Filter → Subset on Update
to ensure that the restricted data set only was used for analysis, rather than just for display purposes,
and then by using Spread → Restrict/Filter → To Groups (factor levels)... to include only values with Sex=1.
The data analysis (Stats → Mixed models (REML) → Linear mixed models…) was then conducted as shown by the dialog boxes below for body weight - saving the predicted mean values for seasonal period (CALEYR) in a spreadsheet. It is then a simple matter to copy and paste the column of mean values into the appropriate column in